The global vacation rental market has swelled to become an estimated $100+ billion industry and growing. And yet, some Airbnb and Vrbo short-term rental property managers and vacation rental owners are seeing a downturn in the market. Rapid growth can lead to over-saturation, and vacation rental owners and managers are facing increasing competition, higher guest expectations, and complexity in managing their business operations.
Enter metrics! Occupancy rates, pricing, guest satisfaction, and other vacation rental data are increasingly important to a vacation rental business’s longevity and success. However, metrics can be overwhelming without the right tools to analyze and extract actionable insights. This is where business intelligence (BI) comes in.
In this article, we’ll explore how BI tools can measure key factors to help short-term rental businesses succeed in this booming, yet competitive market, including:
- Overview of vacation rental business tools
- Vacation rental BI basics: a metrics glossary
- Key features of vacation rental BI tools
- Vacation rental BI providers
- Vacation rental BI factors to consider
Understanding vacation rental business information tools
Before diving into the specifics of vacation rental BI tools, it’s important to understand the concept of business intelligence itself. In the context of vacation rentals, business intelligence refers to the collection, analysis, and presentation of data and insights related to various aspects of the business.
By leveraging data like occupancy rates, benchmark performance, listing and channel revenue, bookings, guest reviews, and market trends from multiple sources, BI tools provide a comprehensive view of the short-term rental business’s performance.
Vacation rental business intelligence tools also empower property managers to identify patterns, trends, and potential areas for improvement. With predictive analytics, short-term rental managers can forecast future bookings, pricing, occupancy rates, and revenue potential. This forward-looking approach helps vacation rental businesses automate and optimize their day-to-day operations, make strategic decisions, streamline their processes, and stay ahead of the competition.
Vacation rental business intelligence basics: a metrics glossary
While each BI provider offers unique capabilities, some key performance indicators (KPIs) generally considered include:
- Occupancy rates: The most fundamental metric to monitor short-term rentals across targeted dates, properties, neighborhoods, etc.
- Total revenue: Track how vacation rental income is growing over time by source listing or property.
- RevPAR: Measure revenue per available rental night to assess pricing optimization.
- Average daily rate: Evaluate seasonal and event-based price adjustments through ADR monitoring.
- Lead to booking conversion: Indicate the sales process efficiency from the first inquiry to confirmed booking.
- Demand: Calendar heat maps visualize peak seasonal or event-driven occupancy periods.
- Top performing listings: Identify which properties drive the most bookings and revenue to replicate success.
- Guest metrics: Analyze guest experience, demographics, behaviors, feedback, and lifetime value to inform marketing, social media, and business strategies.
- Channel performance: Track rental results across distribution channels (Airbnb, Vrbo, Booking.com, etc.) to guide the right mix of OTAs.
- Local market benchmarks: Compare your metrics against neighborhood or city competitors.
Drilling into these key data points will help property managers and vacation rental owners set strategies, adjust operations, and ultimately maximize rental revenues.
Key features of vacation rental business intelligence tools
When considering business intelligence tools for vacation rental businesses, there are several key features to look for. Let’s explore a few.
Data integration
BI tools should be capable of integrating with various data sources, such as property management systems (PMS), booking platforms, and financial data. This integration ensures that all relevant data is consolidated and accessible in one centralized platform.
Customizable dashboards
The ability to create personalized dashboards that visualize key performance indicators (KPIs) is essential for monitoring business metrics. These dashboards should allow owners and property managers to track metrics such as 2 rates, revenue, guest satisfaction scores, and marketing campaign performance.
Data visualization
Business intelligence tools should provide intuitive and visually appealing charts, graphs, and maps that make it easy to understand complex data. By presenting vacation rental data in a visually appealing manner, these tools enable property managers to quickly grasp insights and make data-driven decisions.
Real-time analytics
Timely data updates and real-time analytics allow vacation rental businesses to respond to market changes swiftly. By monitoring key metrics in real time, vacation rental owners and property managers can identify emerging real estate and short-term rental trends, adjust pricing strategies, and optimize marketing efforts to maximize revenue.
Predictive analytics
The ability to forecast future trends and make data-driven predictions helps inform strategic decision-making. By leveraging predictive analytics, vacation rental businesses can anticipate demand fluctuations, optimize pricing, and allocate resources effectively.
Alerts and notifications
Automated alerts and notifications keep property managers informed about important changes or anomalies in their data. Whether it’s a sudden increase in bookings, a decrease in occupancy rates, or a negative trend in guest reviews, these alerts enable quick action and proactive management.
Vacation rental business intelligence providers
Now that we’ve outlined some of the uses and features of BI tools in short-term rental businesses, let’s look at a few commonly used vacation rental software platforms. But first, it’s worth noting that when investing in BI tools, consider which integrations your PMS’s channel manager supports.
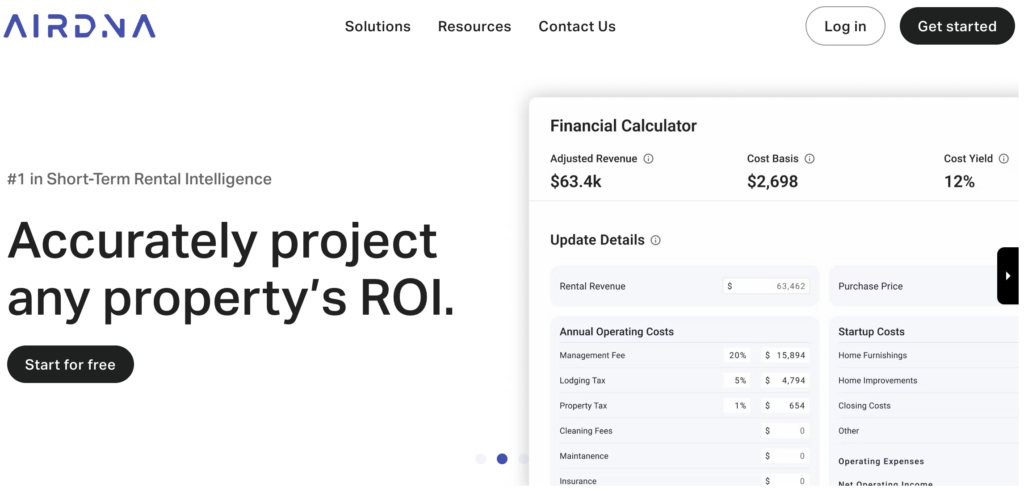
AirDNA

- Focus on Airbnb and Vrbo data and analytics
- Provides granular vacation rental data down to neighborhood and property level and large-scale analytics across countries and internationally
- Occupancy rate and revenue calculations
- Pricing and calendar optimization tools
- Especially helpful for researching new vacation rental markets and analyzing competitors
- Price point: starts at free. For additional years of data, submarket, individual listing data, and more, subscriptions start at $15/month and go up to $1,200/month.
“AirDNA gives hosts the ability to quickly and easily identify their top local competitors and see key attributes for these listings, such as average daily rate, annual revenue, and annual occupancy rate. Some of these metrics you can get by spending hours researching competitors on Airbnb and Vrbo, but other data points — like real occupancy rate — you simply can’t know without a tool like AirDNA. Having all this information at your fingertips saves hosts hours of manual research time and lets you make decisions based on real information and trends, not just what a neighbor said.
To make it even easier to act on this information, AirDNA provides Smart Rates nightly rate recommendations that take into account key factors like seasonality, day of the week, rental demand and more to suggest the best nightly price. AirDNA also lets hosts see six months into the future to understand booking trends like lead time, pricing, and competition.”
—AirDNA
Key Data Dashboard

- Aggregates custom and API data across multiple short-term rental sites including Airbnb, Vrbo, Booking.com, and direct booking property managers
- Provides complete vacation rental market overview by market
- Calculates key metrics like RevPAR (revenue per available rental)
- Enables granular segmentation by property type, bedrooms, etc.
- Advanced pricing analytics tools using huge datasets
- Price point: detailed market report starts at $295/report
“One of the standout features of Key Data is its data aggregation capabilities. The platform seamlessly integrates with your property management system, collecting data from various sources. This integration enables property managers to navigate the local landscape with accurate and comprehensive data at their fingertips. With access to aggregated benchmarks based on actual reservation data, managers can gain a competitive advantage by comparing performance with local competitors.”
— Key Data Dashboard
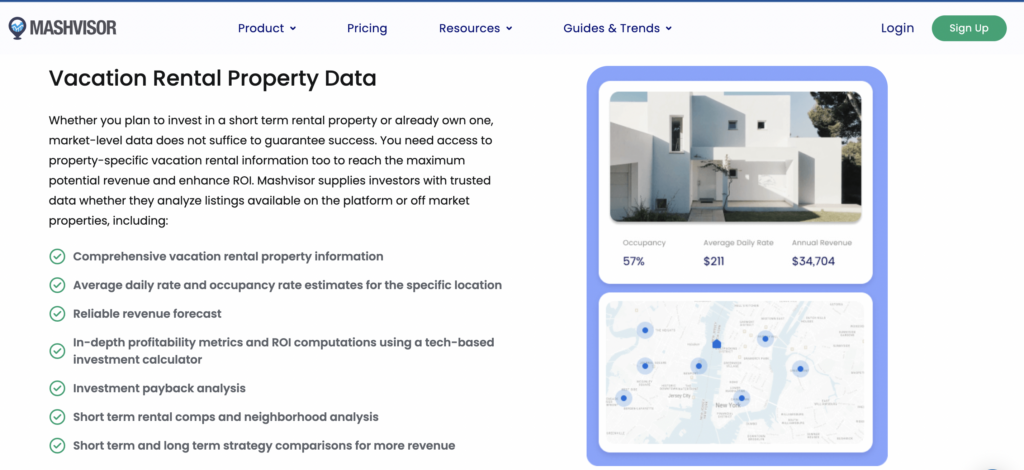
Mashvisor

- Emphasis on helping investors identify and evaluate rental properties
- Mashvisor Score rates potential investment properties and real estate markets
- Analyzes key factors like price, occupancy rates, cap rates, cash flow across cities, neighborhoods, and properties
- Visual heat map shows the concentration of rental properties
- Integrates with Airbnb and Vrbo for operating projections
- Price point: ranges from $29.99/month to $119.99/month (bill quarterly)

Vacation rental business intelligence tools: factors to consider
So what should short-term rental managers look for when selecting BI software? Here are some questions to consider:
- Your short-term rental business model: Multi-unit hosts need robust benchmarking, revenue management, and forecasting capabilities versus a single Airbnb homeowner who may just require an occupancy rate overview. Identify your top business questions and scalability goals to address through BI.
- Ease of use: Do the graphs, charts, and interface seem intuitive or overwhelming? Are the automation and functionality easy to navigate? Seek demos and read reviews to gauge the learning curve.
- Customer service: What training resources and ongoing support does the provider offer? Look for responsive vendor teams, tutorials, and robust help centers.
Conclusion
In today’s increasingly competitive and complex vacation rental industry, property managers face an overwhelming amount of data. Business intelligence software is the tool needed to derive meaning from the numbers and turn insights into action.
With capabilities like benchmarking performance against local competitors, optimizing pricing strategies, identifying high-value guest targets, monitoring smart home devices, and beyond, BI paves the way for short-term rental businesses to make strategic, data-driven decisions.
The bottom line? Leveraging business intelligence translates to increased bookings, maximized rental income, and long-term viability and profitability for your vacation rental business.
In the vacation rental universe, data is king. So come embrace the power of business intelligence to claim your rental revenue crown.
Frequently asked questions
How much do vacation rental business intelligence tools cost?
Pricing can range based on features. Entry-level basic BI dashboards start around $20 per month. Robust platforms with expansive capabilities and customer support can cost $200+ monthly. Most tools fall between $50 to $150 per month. Compare free trials and look for discounts on annual contracts to find the best value.


